Introduction
In the STEM Foundation Year at the University of Leicester, we used the e-assessement system Numbas. This system recorded enough information for me to be able to investigate when students did their homework.
To help understand the charts that will come below, it will help to know how the assessment was structured.
- There were two semesters.
- In Semester 1, we taught Physics 1, Physics 2 and Maths 1.
- In Semester 2, we taught Physics 3, Physics 4 and Maths 2.
- The physics modules were structured as follows:
- Each module lasted half a semester.
- Each module had 4 weekly e-assessments, made available on Monday and had a deadline of 10am on the Monday after.
- Various other assessments whose details do not matter.
- The maths modules were structured as follows:
- Each module lasted a whole semester.
- Each module had 8 weekly e-assessments, made available each Monday.
- For Maths 1, there was a single deadline which was the weekend before exams.
- For Maths 2, there were weekly deadlines like in Physics.
The reason for the inconsistent structure is because we were trying to find out what works.
Collecting and cleaning the data
As mentioned above, we used the Numbas e-assessment system which recorded lots of data, including when students attempted their work. A colleague was in charge of maintaining the system, so I asked them to extract the data for this little project. They did this using a SQL query, and passed the data to me as a csv file.
I then cleaned the data. This involved:
- Removing entries that did not correspond to my students.
- Determining which assessment each entry corresponded to. This was trickier than expected, because the staff on our team used different naming conventions and because the system produced three different ids for each assessment.
- Deciding how to deal with fact that we allowed students to attempt the assessment multiple times. In the end, I decided to pick the first attempt out of all these; it had negligible impact on the final charts.
- Deciding how to deal with fact that a student could start an assessment on one day, but finish it later. I decided to pick the time a student first opened an assessment, which I called ‘Start Time’.
On the technical side, I used R.
- I learnt some R by working through R for Data Science, which is an excellent online book that I highly recommended.
- For this project, the key tools I used were tibbles, piping and ggplot2.
- The other noteworthy technical aspect of this project was getting the x-axis, representing time, to appear just as I wanted. I remember this took significant effort, banging my head over the table to understand POSIXct and POSIClt.
The charts
Below are the charts for the Physics modules. The x-axis shows the day a student opened an e-assessment and the y-axis shows the number of student who started on each day. The different colours correspond to the different assessments.
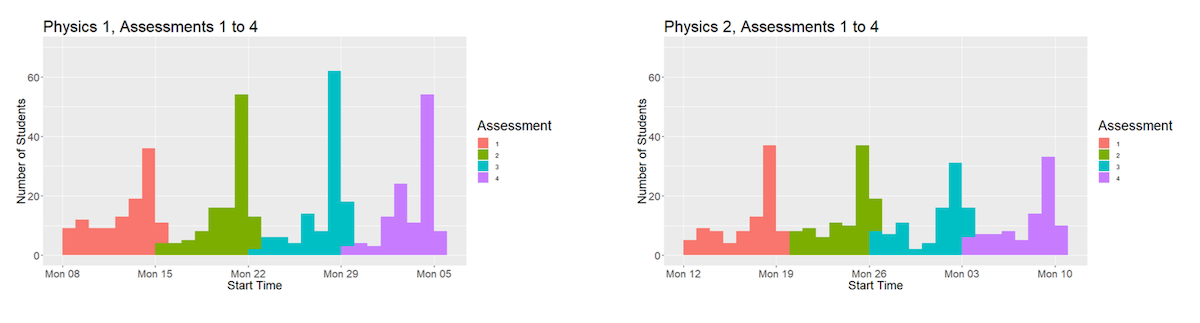
Physics 1, 2 and 4 all have the same patterns.
- A good chunk of students open the e-assessment before the weekend.
- The modal day to open the e-assessment is Sunday, the day before the deadline.
- Several students open the e-assessment on Monday (so after midnight on Sunday).
- The bars are shorter in the Physics 2 and Physics 4 charts because fewer students do those modules.
Physics 3 has a different pattern. The first assessment has the same shape as in the other three modules. The other three assessments are flat for a few weeks and then all bunch up in the week beginning Monday 11th Feb. The reason is that at the end of the first week of Physics 3, we extended the deadline for all the assessments to 10am on Monday 18th Feb. (We did this to account for unforeseen circumstances).
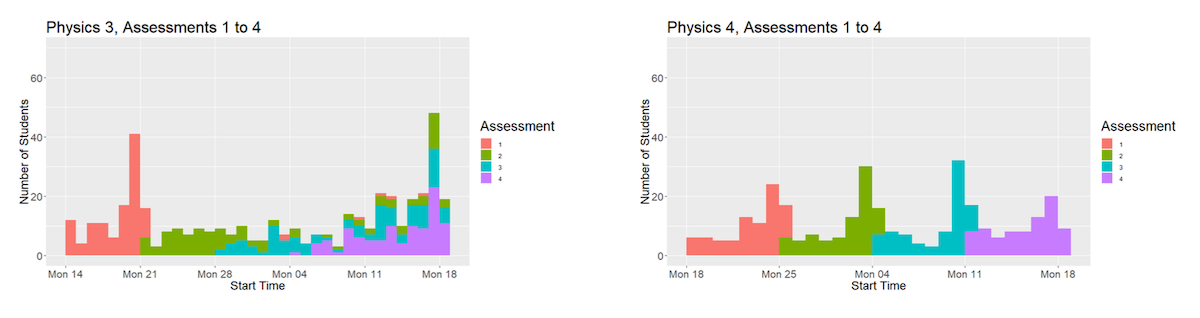
Below are a sample of charts showing the breakdown of timings during Sunday and Monday.
I do not think there is anything particularly noteworthy in these charts. The main pattern is that most people who started the work on Sunday did so after 6pm. The thing which struck me was that for each assessment, there were several students who started the work between 3am and 9am.
As a result of this data, the director of the Foundation Year decided to change the deadlines from 10am on Monday to 10pm on Sunday.
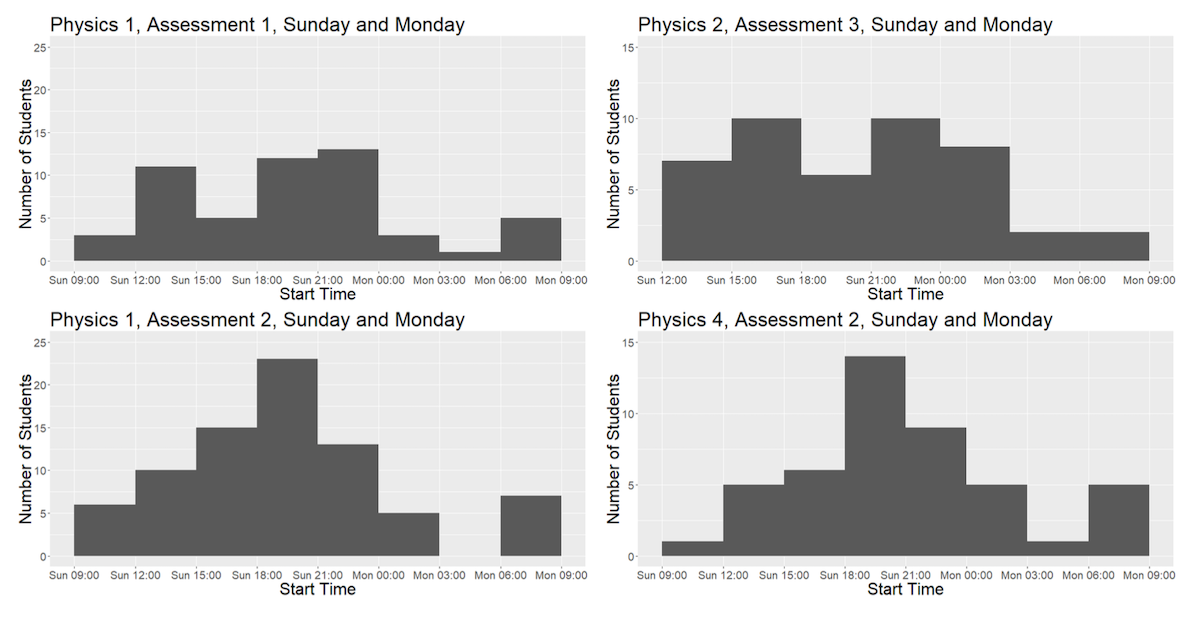
Below are the charts for the two maths modules.
Recall that in Maths 1, there was a single deadline for all the assessments, which was the weekend before exam week.
- In the first half of the semester, there is a decent chunk of students starting the e-assessments.
- In the second half, engagement drops significantly. My explanation for this is that the e-assessments for Physics 2 were considerably longer/harder than those of Physics 1, but there are likely various factors.
- A lot of work was done over the Christmas break. To my surprise, a few students left all the work to be done on the final weekend!
Recall that Maths 2 had weekly deadlines. Recall also that Maths 2 runs concurrently with Physics 3 and Physics 4.
- When we extended the deadline in Physics 3, we also had to do it for Maths 2.
- Like in Physics 4, the deadlines for second half of Maths 2 were weekly.
- Hence, the first half of Maths 2 resembles Physics 3, and the second half of Maths 2 resembles Physics 4.
Conclusions
Many people who see this will say ‘This is obvious, what is the point?’. There are two main points.
- First, it is good to have quantitative data. It provides clearer understanding and also allows us to measure changes from one year to the next.
- Second, the higher education industry puts too little weight on (appropriate) data and observations. Either a lecturer simply does not care about teaching (in which case they put no weight on anything) or a lecture does care but bases their decisions on an imagined conception of what students are.
What conclusions did I draw from this?
- The pattern for weekly deadlines is consistent across the year: there is some activity throughout the week, with a clear peak the day before the deadline.
- One consequence is that we cannot assume comfort with material taught on Monday during a session later in the week, e.g., on Thursday.
- Students respond to incentives, just like the rest of us.
- Our choices have a big impact on student habits.
- Noteworthy to point out that most students do know the deadlines! This means we are communicating our deadlines well.
- Thinking about incentives is important more generally. E.g. it explains the difference between attendance in lectures and attendance in assessed sessions.
- These findings are particularly important for ‘linear’ subjects, where knowledge/understanding of Week 1 material is required to learn Week 2 material.
- Shouldn’t judge students or label them as ‘bad students’.
- Better to label the habit, not the individual.
- This is more to do with human nature, than students in particular.
- This is mostly about incentives. Designing a course well includes creating incentives which result in good learning behaviours. (Compare with the famous example of opting-in or opting-out of a country’s organ donation registry.)
Limitations of the data
There are several sources of noise and error in this data. I will say ‘data is positively biased’ to mean that data shows students working earlier than they actually are, and ‘negatively biased’ to say that data shows students are working later than they actually are.
Sources of positive bias.
- Looking at Start Time. Students may open the assessment during the week, but actually only finish it on the weekend.
- Students have multiple attempts on the coursework and I only looked at the start time of their earliest attempt.
- I excluded students who did not attempt the coursework or attempted it late.
Sources of negative bias.
- There was a ‘Practice Version’ of each e-assessment available. Students were encouraged to use these to practice before attempting the actual assessed version. Some students did this, but a brief look at the data shows that most people did not attempt these.
- Did not take into account mitigating circumstances, e.g. illness.
- Does not account for other forms of independent study. E.g. a student might review lectures/workshop questions before attempting the e-assessment.
Sources of unknown bias.
- Most of our students have done A-Level Maths and/or Physics, so find the year easy. This probably means that students do not need to attempt coursework in a timely manner in order to keep up with the material.
- This data only relates to specific style of coursework. There is no data on semester long projects, essays, etc. My prediction is that similar patterns will emerge, but spread out according to the size of the task.
- Several students suspended or withdrew or were terminated during year. Their data will be included in early modules but not in later modules.