Santander Dataset, Part II, Feature Selection
I carry out several feature selection algorithms, with the hope of removing features that are reducing the performance of the models.
Other posts in series
Introduction
After some Googling and reading of various blog posts and articles, I decide to carry out a few different feature selection techniques, record them all in a pandas frame, and pick out the important features as appropriate. The feature selection techniques I use are:
- Calculate ANOVA F-value between each feature and prediction target
- Obtain feature importances from XGBoost model
- Calculate correlations between each feature and prediction target
- Obtain coefficients from logistic regression with L1-regularisation
- Obtain coefficients from logistic regression with L2-regularisation
Visualising the feature scores
Below are plots showing how the different methods of measuring feature importance compare with one another.
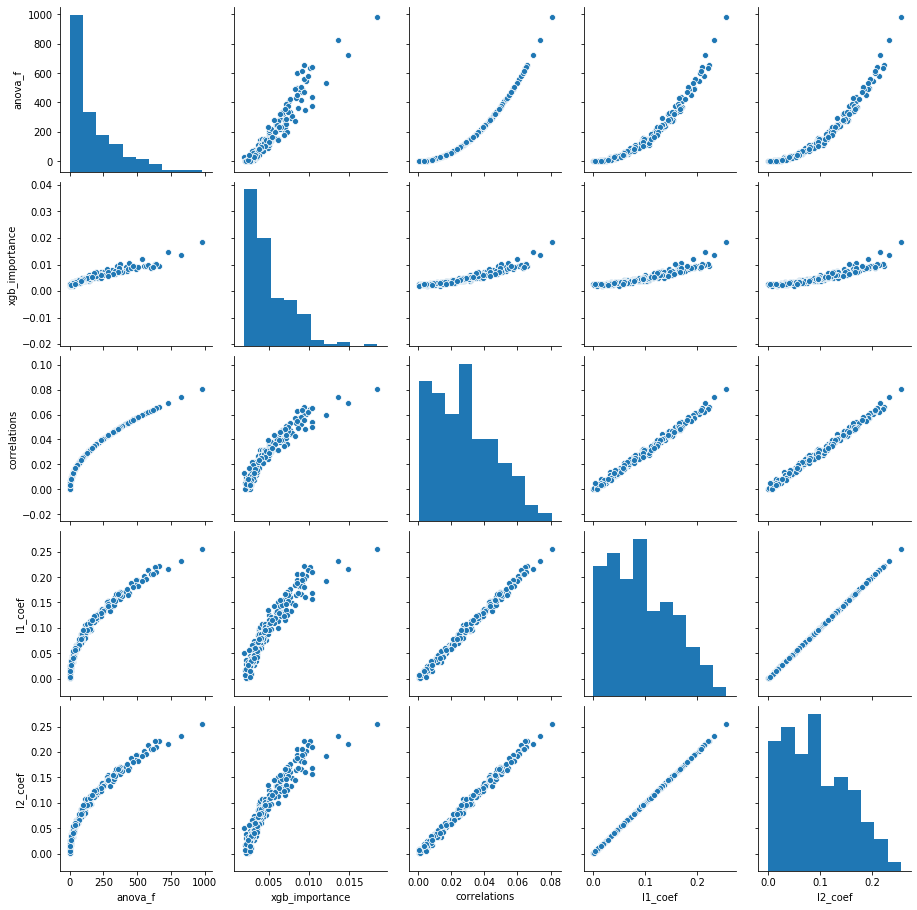
The main takeaways for me are:
- The different measures are all strong correlated with one another. This is a good thing of course, because it means there really is a consistent notion of feature importance.
- The ANOVA F-values and correlations seem to provide exactly the same information. This is presumably not a coincidence, and there will probably be simple mathematical relationship between correlation and the F-values.
- The L1- and L2-regularisations have a perfect correlation. Visually scanning the coefficients also showed they were almost exactly the same. This makes me suspicious and wonder if I did something wrong. As far as I could tell I did not. This is something for me to investigate in future, because I was expecting L1 and L2 regularisations to produce some noticable difference.
- The logistic regressions and correlations have a very strong correlation. From my understanding this is not a coincidence - I believe there is a direct relationship between the coefficients and correlations (at least when there is only one feature variable).
- The XGBoost feature importances are least correlated with the others. I suppose this makes, because I think the other four quantities have direct mathematical relationships between them, whereas tree-models are qualitatively different.
To remove the non-linearity in some of the charts above, I decided to also plot feature ranks that these different measures produce.
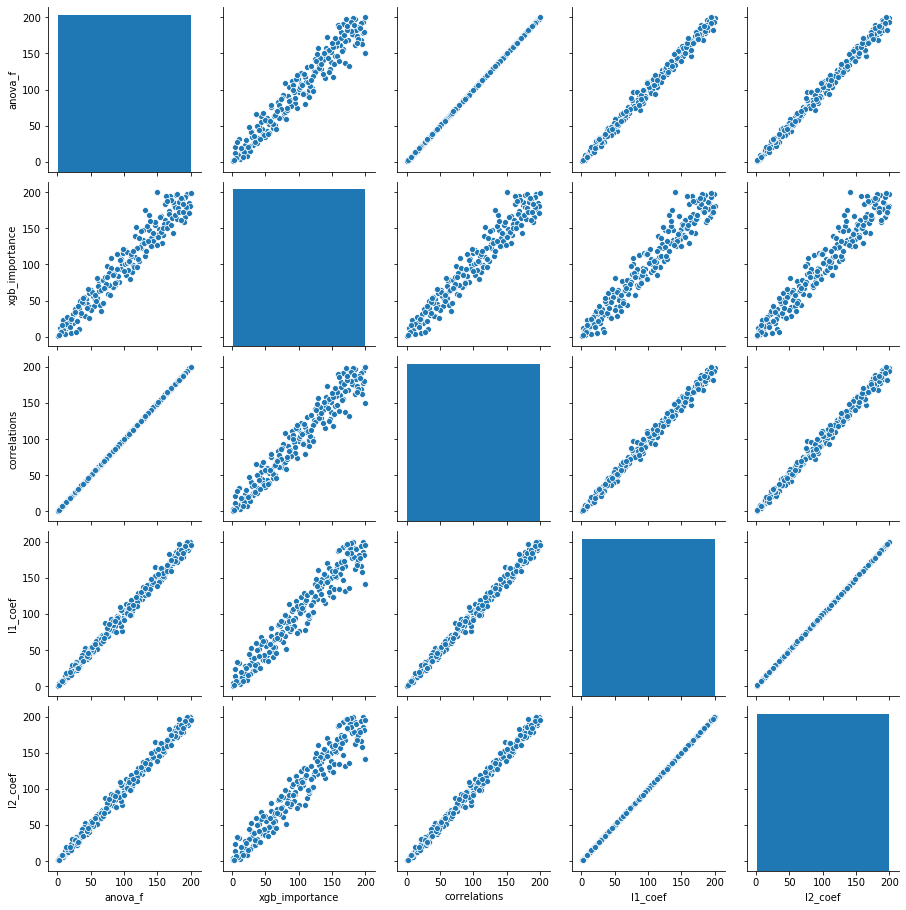
There is nothing new shown in these graphs - it just makes the patterns listed above a bit clearer.
Models with only the most important features
Next I produced several logistic models keeping differing amounts of features removed. I used logistic models because they were the quickest to create.
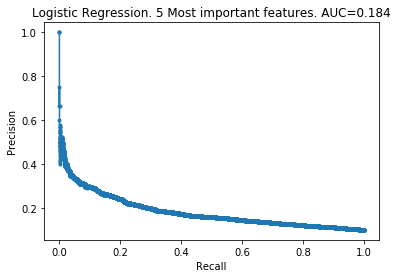
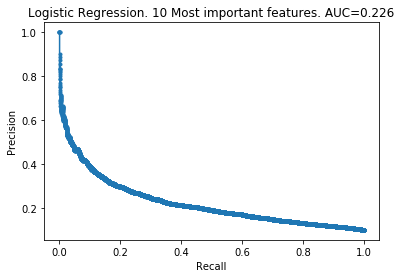
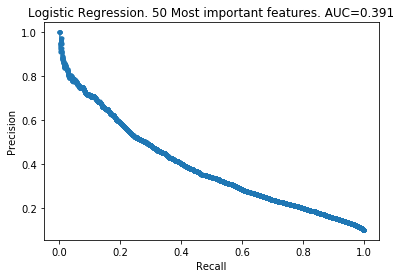
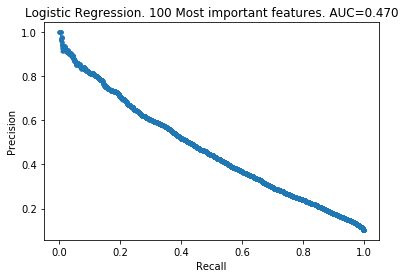
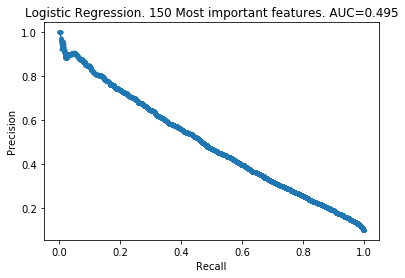
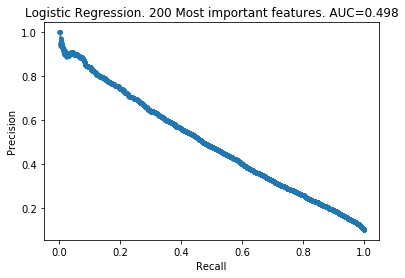
The patterns here are clear. My takeaways are:
- As you increase the number of features kept, the model improves.
- The 100 least important features provide very little information to the models.
- However, the 100 least important features do provide some information. The models did not improve by removing them.
Conclusion
It looks like removing the least important features has not improved our models. The one thing it did improve was the time taken to create the models. Also, in a real-life situation (where we knew what the variables corresponded to), we would have gained insight into which variables are important, which presumably would help in decision-making.
Next steps
The next thing I will do is some hyper-parameter optimisations. After that, I will have used up all the tricks I have available, and then look at other people’s models and see what I can learn.