- Other posts in series
- Quick Personal Background
- First steps
- AUPRC
- Enough text, time for pictures
- Next steps
- The code
Other posts in series
Quick Personal Background
I have been studying programming and data science using various resources. The main resources I have used so far, for data science specifically, are the Kaggle Courses. I have completed:
- Intro to Machine Learning
- Intermediate Machine Learning
- Pandas
- Data Visualisation
Following the advice I have read in numerous places, I decided I should try to do some data science of my own - not just follow some exercises. I skimmed through the Kaggle datasets, and this dataset on credit card fraud caught my fancy, so I jumped right in!
First steps
In the description, it said that there are 284807 transactions with only 492 labelled as fraudulent. The task is to create a model to predict which transactions are fraudulent. The description also said that because the percentage of fraudulent cases is so small, it is best to use “AUPRC”, Area Under the Precision-Recall Curve, to evaluate the model. I had not heard of this yet so I did some Googling.
I found this blog post by Jason Brownlee, which explained what AUPRC is with some examples. This was helpful and I used the same packages he did.
Before going onto AUPRC and my models, I should say that there was no need to do any data cleaning for this dataset. It had already been cleaned and the data has been anonymised via a PCA. Again, I have not studied this yet, but a brief skim of this wikipedia article on PCAs gives me some basic insight. It looks neat actually - it replaces the original data with new data which captures the variation in the old data but in such a way that the features in the new data have minimal correlation between them. My intuition is that the less correlation there is between features, the better the models works. PCA is definitely something I need to look into more at some point!
AUPRC
I will try to summarise the idea behind AUPRC.
- The framework.
- We have features
Xand we are trying to predicty. In this case,ysays whether the transaction is fraudulent or not. Ify=0then the transaction is not fraudulent, and ify=1then it is. - The models produce values of
ybetween 0 and 1, representing the probability of a transaction being fraudulent. - To decide if a transaction is fraudulent or not, we need to also specify a threshold probability,
p. Ify>p, we label that transaction as fraudulent.
- We have features
- Precision and Recall
- Precision is the fraction of transactions that are labelled as fraudulent that actually are fraudulent. I somehow find it easier to think about 1-Precision, which measures how many false-positives we have.
- Recall is the fraction of actually fraudulent transactions the model manages to label as fraudulent. Again, I find it easier to think about 1-Recall, which measures how many false-negatives we have.
- A perfect model has a precision and a recall of 1. This is not possible and we need to make a trade-off between them. This trade-off is achieved by varying the threshold probability
p.
- The Precision Recall curve
- When
p=1, we are saying all transactions are not fraudulent (because you need to assign a probability greater than 1 in order it to be considered fraudulent, which is not possible). Therefore, there are no false positives so we have a precision of 1, but we have not found any of the fraudulent transactions, so the recall is 0. - When
p=0, we are saying all transactions are fraudulent. Therefore, all the fraudulent transactions are found so we have a recall of 1, but we have a huge number of false positives, so a precision almost equal to 0. - As we vary
pfrom 1 to 0, we move from the the coordinate (0,1) to (1,0), and we are hoping to get as close to the coordinate (1,1) as possible.
- When
- The Area Under the Precision-Recall Curve
- The closer we get to (1,1), the larger the area under the curve is.
- A perfect model would reach (1,1) and achieve an area of 1.
- The worst model, where you assign probabilities at random, will produce a straight line connecting (0,1) to (1,0), giving an area of 0.5.
- Thus the AUPRC is a measure of the model, with a value between 0.5 and 1.
Enough text, time for pictures
Below you will find the precision-recall charts for the various models that were created, along with their AUPRC metric.
Basic model
I started by creating a basic model, where it just assigns a probability of 0.1% for any transaction to be fraudulent.
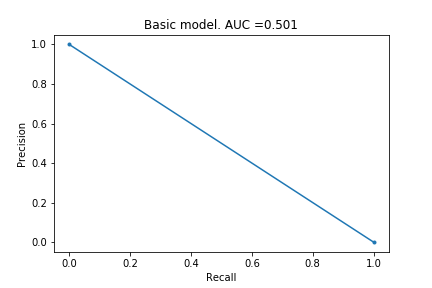
As you can see from the chart and the AUPRC of 0.501, this model is poor. No surprises here, which I suppose is a good thing.
Logistic Regression
I have not studied logistic regression yet so I do not actually know what it does differently to linear regression. I decided to still use it because it is the model Jason Brownlee used in their example, and I wanted to follow their example before exploring on my own.
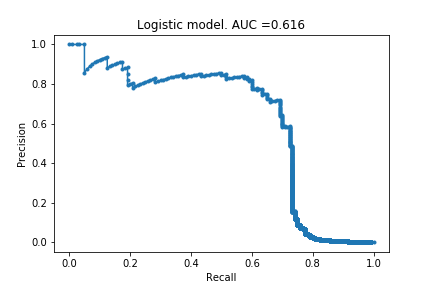
Huzzah! My first non-trivial AUC curve. The model can identify 60% of the fraudulent cases without too many false positives (roughly 20%). The precision falls dramatically if you try to increase the recall.
Decision Tree
Next I tried a Decision Tree model. (This is the first model taught in Kaggle).
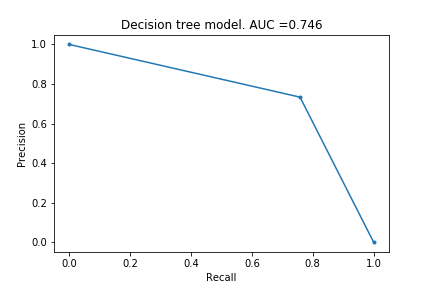
Curve looks very simple, but it has actually extracted some information. It can identify ~75% of the fraudulent cases with a precision of roughly 0.75. I would argue this is better than the logistic regression, because the cost of fraud is greater than the cost of mis-identifying something as fraud.
Random Forest
Next I tried a Random Forest model. (This is the second model taught in Kaggle).
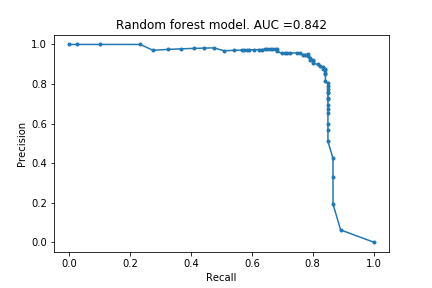
Woh! I was surprised by how good this is. 80% of the fraudulent cases identified with a precision of 95%! Lets see if the infamous XGBoost can do better.
XGBoost
Drum roll please…
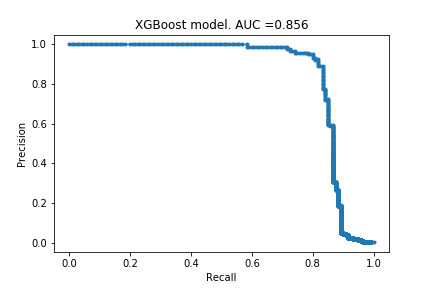
Looks very similar to the random forest model. I do not know if this is surprising or not - hopefully I will get more intuition for these kind of things with more practice.
Next steps
There are various things I would like to try.
- Exploring the data a bit and creating a crude handmade model. Something like find the average of Xi in fraudulent cases and in non-fraudulent cases. Then the probability of being fraudulent is determined by whether you are closer to the fraudulent means than the non-fraudulent means.
- Hyper-parameter optimisations. I used only default settings for all the models. I just wanted to get something made and published before trying to mess around with settings.
- Seeing what happens if I randomly delete 90% of the fraudulent cases from the training. My prediction is there will not be significant loss in information but there should be significant time savings. (The random forest model took a few minutes to run.) This will make hyper-parameter training quicker.
- Exploring the models themselves. What are the probabilities produced by the models? What patterns have the models found?
- After I have done my own investigations, find out what other people did.
The code
Below is the code to produce the XGBoost model. The code for other models is identical but with ‘XGB’ replaced as appropriate. (At some point in future, I will use for loops to loop through the models.)
# import modules
import numpy as np
import pandas as pd

from sklearn.model_selection import train_test_split

from sklearn.metrics import precision_recall_curve
from sklearn.metrics import auc
from matplotlib import pyplot

from sklearn.linear_model import LogisticRegression
from sklearn.tree import DecisionTreeClassifier
from sklearn.ensemble import RandomForestClassifier
from xgboost import XGBClassifier


# create test validation split
y = data.Class
X = data.drop(['Class'], axis = 1)
Xt, Xv, yt, yv = train_test_split(X,y, random_state=0)


# create model and predictions
model_xgb = XGBClassifier(random_state = 0)
model_xgb.fit(Xt, yt)
predictions_xgb = model_xgb.predict_proba(Xv)
predictions_xgb = predictions_xgb[:,1]

# calculate precision, recall and AUC
xgb_precision, xgb_recall, _ = precision_recall_curve(yv, predictions_xgb)
xgb_auc = auc(xgb_recall, xgb_precision)

# plot precision recall curve
pyplot.plot(xgb_recall, xgb_precision, marker='.', label='basic')
pyplot.xlabel('Recall')
pyplot.ylabel('Precision')
pyplot.title(f'XGBoost model. AUC ={xgb_auc:.3f}')
pyplot.savefig('creditcard_1_xgb.png')